Spending-to-Income Ratio: What It Is, How to Calculate It, and What's Healthy

"Am I spending too much?" is the wrong question. The right question is: "What percentage of my income goes to each category — and how does that compare to what's healthy?" Your spending-to-income ratio tells you exactly that. Here's how to calculate it, what the benchmarks are, and how to improve yours.
1. What Is the Spending-to-Income Ratio?
Your spending-to-income ratio is simply how much of your income goes to expenses, expressed as a percentage. If you earn $5,000/month after taxes and spend $4,000, your ratio is 80% — meaning you save 20%.
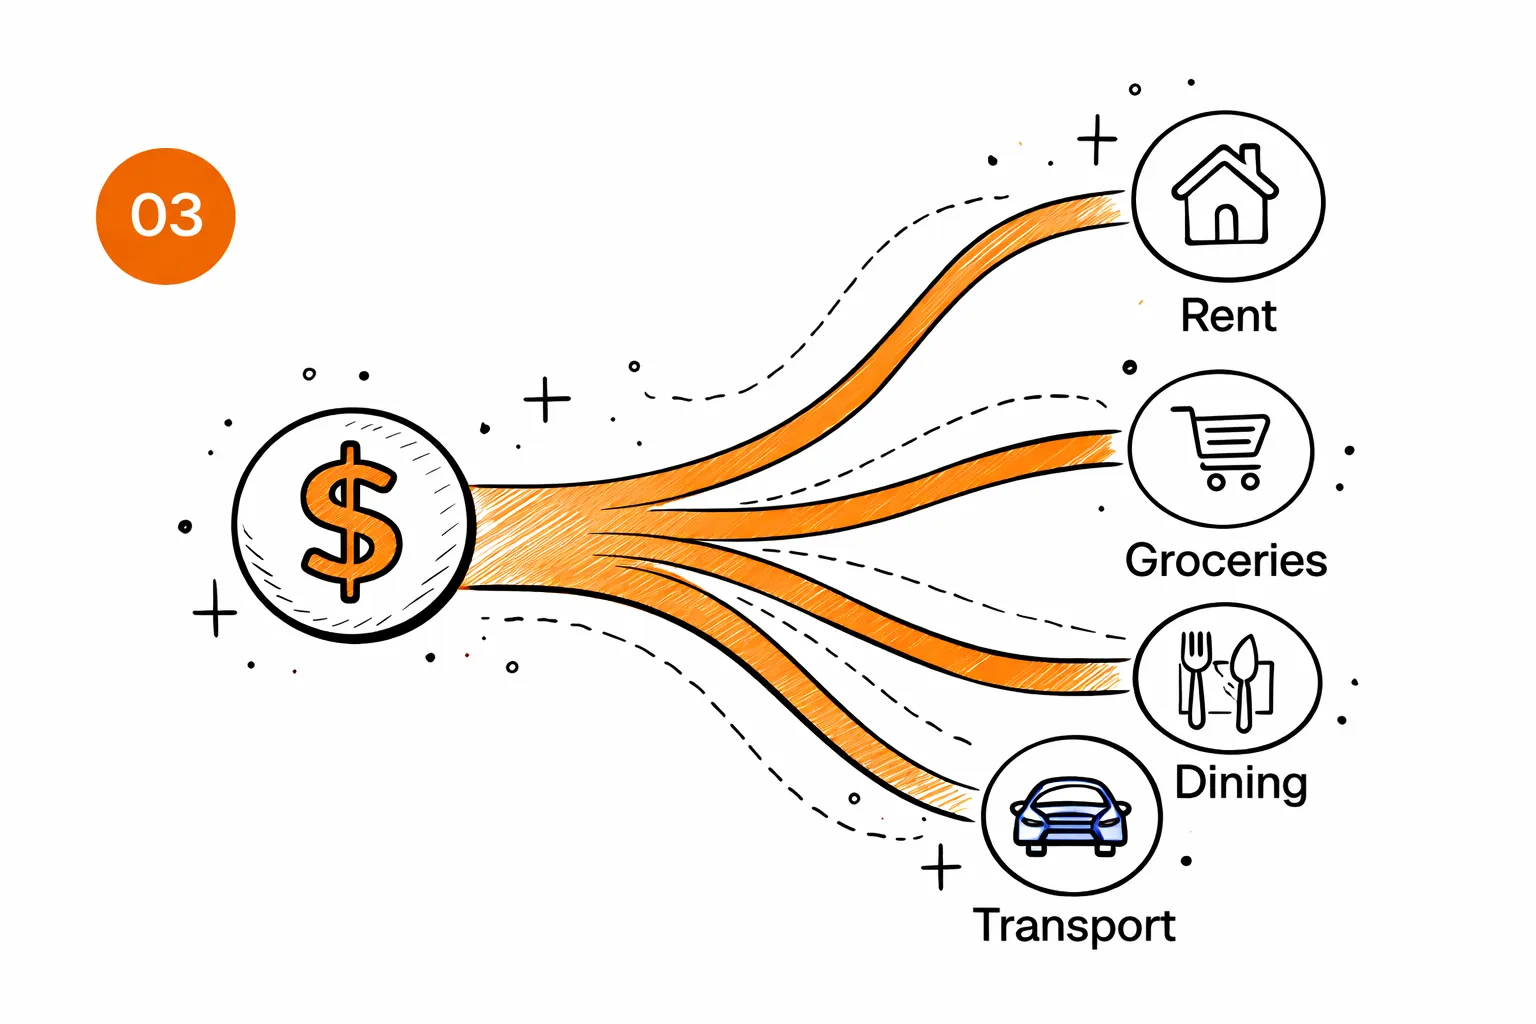
You can calculate it as a single overall number (total spending / total income), or break it down by category to see where each dollar goes. The category breakdown is far more useful — knowing your total is 80% doesn't tell you what to fix. Knowing your dining is 15% when it should be 5-8% does.
This ratio is related to — but different from — your savings rate. If your spending ratio is 75%, your savings rate is 25%. They're two sides of the same coin.
2. How to Calculate Yours
The formula is straightforward:
Step 1: Determine your net monthly income
Use your after-tax take-home pay — the amount deposited into your bank account. Include all income sources: salary, side hustle, rental income, etc. Do NOT use your gross salary; that overstates what you have available.
Step 2: Total your monthly spending
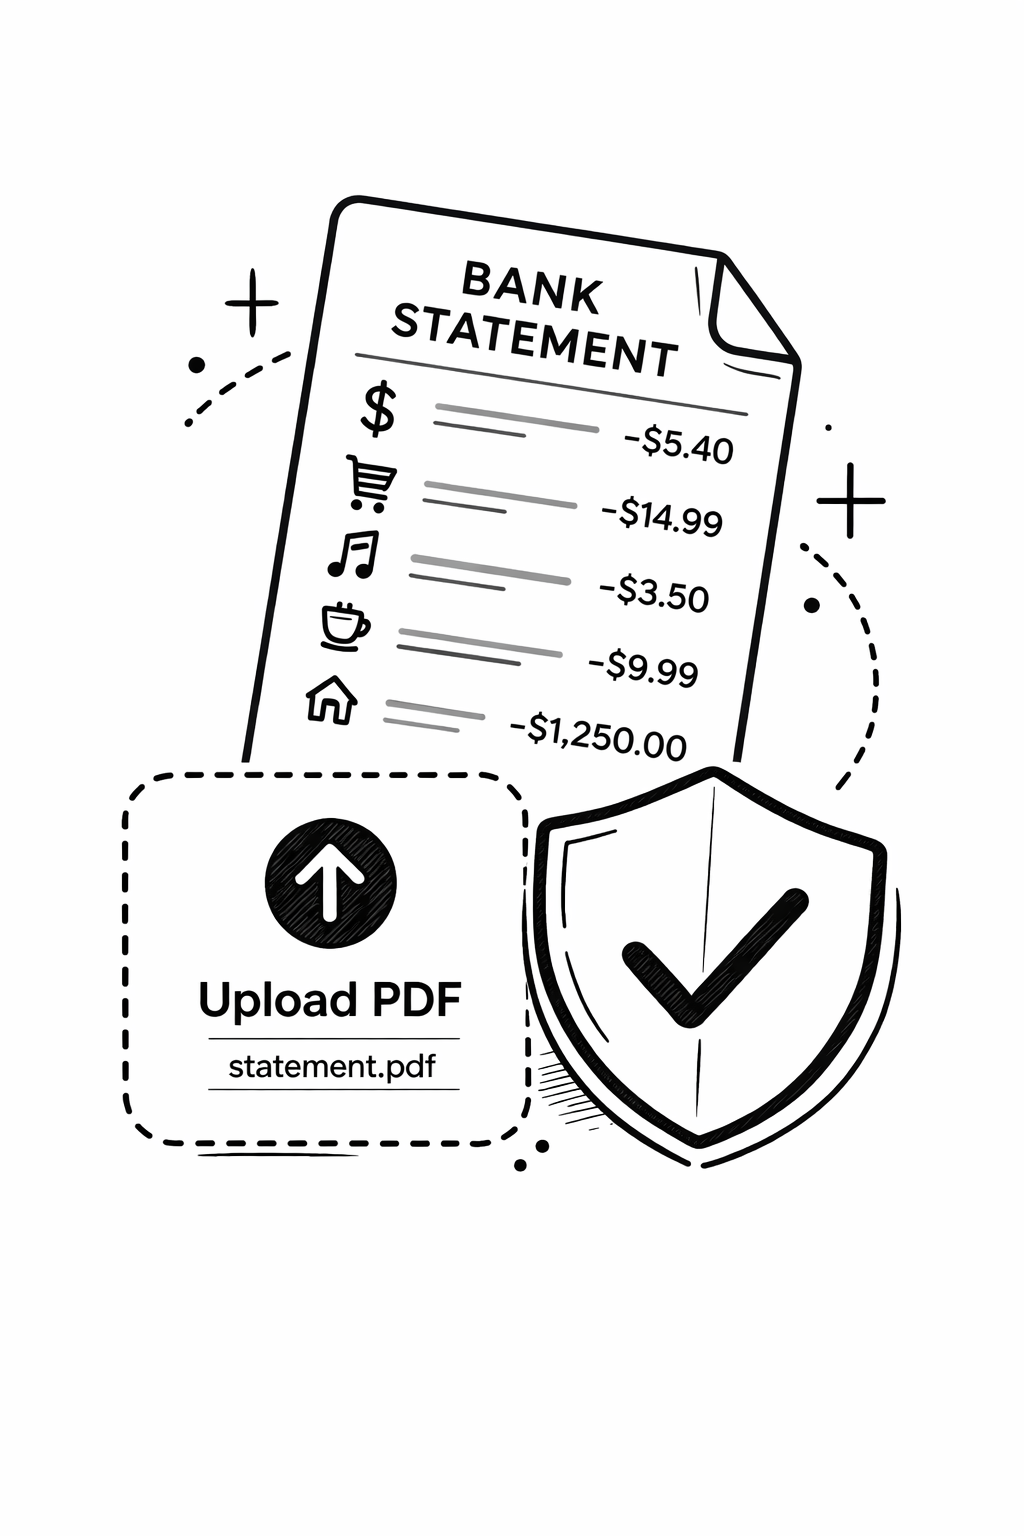
Add up everything that left your account: rent, utilities, groceries, dining, subscriptions, shopping, gas, insurance — everything. The fastest way is to upload your bank statement to a tool that categorizes it automatically.
Step 3: Divide and multiply
Example: Net income = $5,500/month. Total spending = $4,200/month. Ratio = $4,200 / $5,500 = 76.4%. That means you're saving 23.6% — which is quite healthy.
3. Healthy Ranges by Category
Financial planners and lenders use benchmark percentages for each spending category. Here's what's considered healthy (based on net income for budgeting purposes):
| Category | Healthy range | Example ($5,500 net) | Warning sign |
|---|---|---|---|
| Housing | 25-30% | $1,375-$1,650 | Over 35% |
| Transportation | 10-15% | $550-$825 | Over 20% |
| Food (total) | 10-15% | $550-$825 | Over 20% |
| Groceries only | 5-8% | $275-$440 | Over 10% |
| Dining out | 3-5% | $165-$275 | Over 8% |
| Insurance | 5-8% | $275-$440 | Over 10% |
| Utilities | 5-8% | $275-$440 | Over 10% |
| Subscriptions/entertainment | 3-5% | $165-$275 | Over 8% |
| Shopping/personal | 3-5% | $165-$275 | Over 8% |
| Savings/investments | 15-20%+ | $825-$1,100+ | Under 10% |
These ranges follow the principles of the 50/30/20 budgeting rule — where needs are capped at 50%, wants at 30%, and savings at 20%.
4. What Ratios Lenders Look At
When you apply for a mortgage, car loan, or credit card, lenders calculate your debt-to-income (DTI) ratio — which is a specific version of the spending-to-income ratio focused on debt obligations.
Front-end DTI (housing ratio)
Monthly housing costs (mortgage/rent + property taxes + insurance) divided by gross monthly income. Lenders want this under 28%.
Example: $2,000 housing costs / $7,500 gross income = 26.7% (passes).
Back-end DTI (total debt ratio)
All monthly debt payments (housing + car + student loans + credit card minimums) divided by gross income. Lenders want this under 36%, though some accept up to 43% for qualified mortgages.
Example: $2,000 housing + $400 car + $300 student loans = $2,700 / $7,500 = 36% (at the limit).
5. How to Interpret Your Numbers
Once you've calculated your ratios, here's what they mean:
| Total spending ratio | Assessment | What it means |
|---|---|---|
| Under 60% | Excellent | Saving 40%+ — aggressive wealth builder or FIRE path |
| 60-75% | Very good | Saving 25-40% — ahead of most people, on track for early retirement |
| 75-85% | Good | Saving 15-25% — meeting the standard 20% savings target |
| 85-95% | Tight | Saving 5-15% — living paycheck to paycheck with minimal cushion |
| 95-100% | Critical | Saving almost nothing — one unexpected expense away from debt |
| Over 100% | Red alert | Spending more than you earn — going deeper into debt each month |
Don't just look at the total — drill into categories. A 78% total ratio looks decent, but if housing is 40% and you're only saving because you spend nothing on food or fun, that's not sustainable. Balance matters.
6. How to Improve Your Ratio
There are only two levers: spend less or earn more. Both work. Here's the practical approach:
Reduce spending (fastest impact)
- Start with the biggest categories. Cutting housing from 35% to 30% saves more dollars than eliminating subscriptions entirely. Consider a roommate, a smaller place, or refinancing.
- Audit subscriptions and recurring charges. These are the easiest cuts — find all your subscriptions and cancel what you don't actively use.
- Reduce dining by cooking more. Going from $500/month dining to $300 shifts 3.6% of your ratio at $5,500 income. That's $2,400/year. Check our expense reduction guide for more strategies.
- Negotiate fixed costs. Insurance, internet, and phone bills are negotiable. One call can save $30-100/month permanently.
Increase income (bigger long-term impact)
- Negotiate your salary. A $5,000 raise improves every ratio permanently. Most people never negotiate — those who do get raises 85% of the time.
- Start a side income. Even $500/month extra reduces your spending ratio by 5-8 percentage points without cutting anything.
- Invest in skills. Higher-paying roles exist in every field. The ROI on courses, certifications, or a degree often pays back within 1-2 years.
The trap to avoid: lifestyle creep. When income rises, spending rises with it — and your ratio stays the same. Save at least 50% of every income increase to actually improve your numbers.
The Numbers Don't Lie
Your spending-to-income ratio is the single most honest measure of your financial health. It doesn't care about your salary, your job title, or what your friends earn. It only asks: are you spending more or less than you make, and by how much?
Most people don't know their ratio because they've never calculated it. The ones who do are almost always surprised — in at least one category, they're spending significantly more than they thought. That surprise is the catalyst for change.
Frequently Asked Questions
What is a good spending-to-income ratio?
A healthy total spending-to-income ratio is 70-80%, meaning you save 20-30% of your income. For individual categories: housing should be under 28-30%, food under 10-15%, transportation under 10-15%, and debt payments under 36% total (including housing).
How do I calculate my spending-to-income ratio?
Divide your total monthly spending by your monthly after-tax income, then multiply by 100. Example: $4,000 spending / $5,500 income = 72.7%. You can also calculate per-category ratios: $1,500 rent / $5,500 income = 27.3% housing ratio.
What spending-to-income ratio do lenders look at?
Lenders primarily check your debt-to-income (DTI) ratio — monthly debt payments divided by gross monthly income. Front-end DTI (housing only) should be under 28%. Back-end DTI (all debt) should be under 36%. Some lenders accept up to 43% for qualified mortgages.
Is the ratio based on gross or net income?
It depends on the context. Lenders use gross (pre-tax) income for DTI calculations. For personal budgeting, use net (after-tax) income — the amount that actually hits your bank account — as it gives a more realistic picture of what you can afford.
How can I improve my spending-to-income ratio?
Two levers: reduce spending or increase income. For spending, start with the biggest categories (housing, transport, food) since small percentage improvements there have the largest dollar impact. For income, negotiate a raise, take on side work, or develop skills for higher-paying roles.
Free tool · 30 seconds · No signup
Calculate your spending-to-income ratio instantly
Upload your bank statement — AI categorizes every transaction and shows your spending breakdown with percentages. See exactly where your money goes.
Better fit for this topic